
If you’re in your second year of engineering, it’s time to move beyond tutorials and start working on Real SRE Projects. You’ve probably already done the expected things — data structures & algorithms, a couple of web apps, maybe some competitive programming on the side. That foundation matters. Nobody is taking that away from you.
But there’s a gap. And you’ll feel it the moment you get close to a real production system.
You know how to solve problems, but you don’t yet know how systems behave at 3 a.m. when something breaks quietly, halfway through a transaction, across three services you don’t fully control.
That gap has a name. It’s what Site Reliability Engineering was built to close.
And here’s the part no colleges or universities will ever admit — they teach you how to pass a 70 marks exam, not how to survive a database failure when there are hundreds of concurrent transactions at 6am.
What Is Site Reliability Engineering — and Why Should Students Care?
Site Reliability Engineering, commonly called SRE, is the discipline of building and operating software systems that are reliable, scalable, and recoverable. Google formalized it, but the principles apply everywhere — from early-stage startups to large infrastructure teams.
SRE is not a collection of tools. It’s a way of thinking about software under pressure — when traffic spikes unexpectedly, when a dependency goes down, when a bad deployment rolls out at midnight and no one is watching.
Most students never encounter this in college. You build projects that work once during minor or major projects in last semester, under controlled conditions, with clean inputs. SRE asks a completely different question: what happens when things go wrong, and how fast can your system recover?
The engineers who stand out early in their careers aren’t just the ones who write clean code. They’re the ones who’ve thought about failure before it happens.
Why Your Current Projects Have a Ceiling?
The typical student project lifecycle looks like this:
- Build the app
- Get it running
- Submit or deploy
- Move on
That workflow teaches you a lot but It does not teach you what happens in production.
In real systems:
- Services crash without warning
- Latency spikes for reasons that take hours to trace
- A single dependency going down cascades into total failure
- Traffic behaves nothing like your assumptions
When these things happen, the difference between a recoverable incident and a disaster is almost entirely determined by decisions made before the failure occurred — not during it.
If your projects have never exposed you to failure scenarios, you haven’t been practicing the hardest part of the job. You’ve been practicing the easy part and calling it preparation.
Why SRE Feels Hard at First
SRE is not difficult because the tools are complicated. Most of the tooling — logging systems, monitoring dashboards, load testers — is well documented and learnable quickly.
What makes SRE genuinely hard is that it forces you to reason about uncertainty and trade-offs without clean answers.
- Should your system retry a failed request, or fail fast and surface the error?
- Should you prioritize availability or consistency when a database is under pressure?
- How many alerts is too many before your team starts ignoring them?
These aren’t questions with right answers. They require judgment built through experience.
Here’s what you probably don’t realize: your data structures knowledge is directly applicable here.
| DSA Concept | SRE Application |
|---|---|
| Queues | Request buffering and task management |
| Graphs | Modeling service dependencies |
| Hash maps | Caching strategies |
| Backoff algorithms | Retry logic with exponential delay |
| Time complexity | Performance under increasing load |
The concepts are the same. The environment is just messier.
The 10 SRE Projects Every Student Should Build
These projects are divided into two tiers. The first four are flagship projects — deep, system-level builds that will fundamentally reshape how you think about software. The remaining six are focused skill builders designed to reinforce and complement the flagship work.
Before diving into these projects, you need a solid foundation. Without it, even well-designed projects will feel confusing and fragmented. To build that foundation, refer to these two articles: The Architect Path: Skip the Foundations, Pay the Price and Programming Languages That Will Actually Last: No Hype.
Flagship Projects
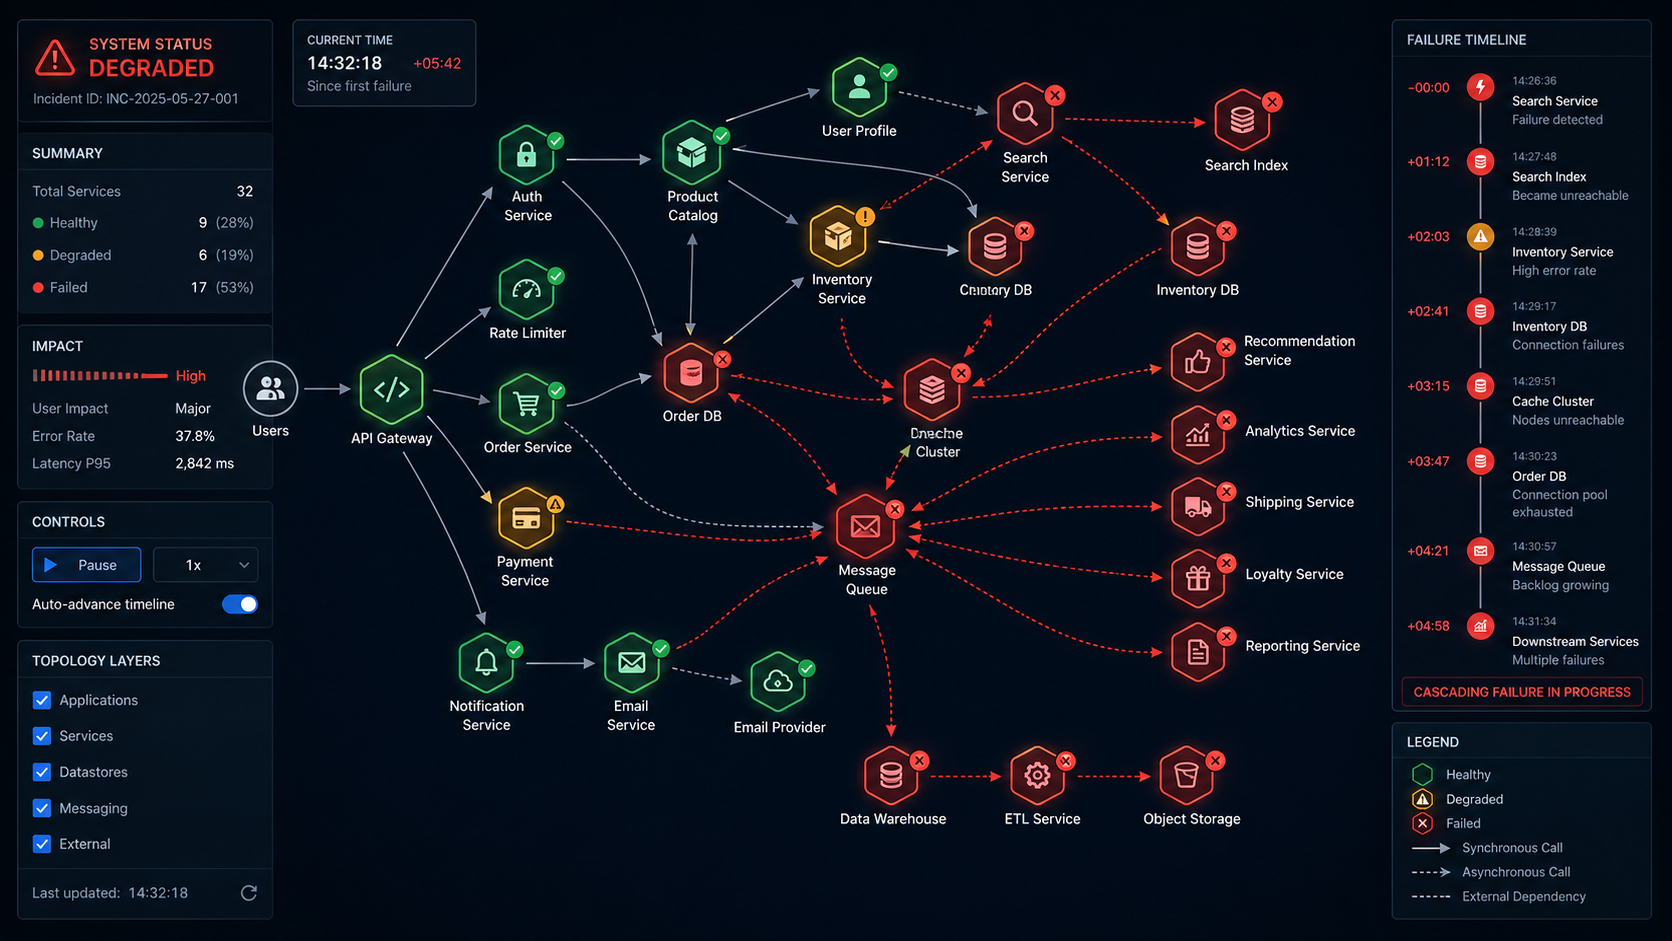
1. Full Observability and Incident Response System
Traditional Approach
Most students rely on console.log statements and manual debugging. When something breaks, you stare at the terminal, guess at the cause, and add more print statements until something makes sense.
Why This Is Hard
In distributed systems, failures surface far from their cause. A request flows through multiple services, but the error only shows up at the top.
Without full visibility, debugging becomes guesswork across scattered logs. It’s not a skill issue. The system just isn’t built to explain itself.
Poor alerting makes it worse. Too many noisy alerts train teams to ignore them, so real issues get missed.
How This Will Help You
From this you will learn how to explain system behavior with data instead of guesswork. You develop the habit of building visibility into a system from the beginning, not as an afterthought. You understand what it means for a system to be observable — and you’ll immediately notice when it isn’t.
Where to Start
- Step 1 — Build a small baseline system: Start with one API service, one database, and a handful of endpoints. Keep it simple. The observability layer is what you’re building here, not the application.
- Step 2 — Add structured logging: Every log line should include a
request_id, atimestamp, astatus, and aservice_name. Format everything as JSON(use ndjson plugin). Consistency is non-negotiable — unstructured logs are nearly useless at scale. - Step 3 — Add metrics: Track request count, latency distribution, and error rate. Expose them through a
/metricsendpoint. These three numbers tell you most of what you need to know about service health. - Step 4 — Visualize: Connect your metrics endpoint to a dashboard. You want to see trends over time, not just point-in-time values. Spikes are meaningful. Gradual degradation is often more dangerous than sudden failure.
- Step 5 — Add distributed tracing: Pass
request_idvalues across service boundaries. When a request enters your system, tag it with an ID that follows it through every service it touches. Now you can reconstruct the full path of any request that fails. - Step 6 — Add alerting: Set thresholds that mean something. Latency above the 95th percentile for more than two minutes. Error rate above one percent. Not every anomaly deserves a page — only the ones that indicate real user impact.
Common Pitfalls
- Logging too much without structure, making logs unsearchable
- No correlation between metrics and logs — you see a spike but can’t find the corresponding requests
- Alerting on everything until the alerts become background noise
2. Chaos Engineering Playground
Traditional Approach
You test your application by using it normally. If it works when you click through it, you assume it works. You might run unit tests. You probably don’t simulate the database disappearing mid-request.
Why This Is Hard
Real failures are random, interconnected, and often subtle. A database doesn’t just disappear — it becomes slow. A network doesn’t fail completely — it drops one in fifty packets. A service doesn’t crash — it starts returning errors for a specific class of request while handling everything else normally.
Testing under stable conditions tells you your system works under stable conditions. It tells you almost nothing about how it behaves when conditions degrade. And conditions always degrade eventually.
The psychological difficulty is also real. Deliberately breaking your own system feels wrong. It requires trusting that the lessons from controlled failure are more valuable than the temporary stability you’re giving up.
How This Will Help You
From this you will develop fault tolerance as a design instinct rather than an afterthought. You learn to ask “what happens when this fails?” for every dependency before you build on top of it. You stop being surprised by production failures because you’ve already seen most of the failure modes in a controlled setting.
Where to Start
- Step 1 — Create a small multi-service setup: Service A calls Service B. Keep it minimal. You need enough complexity to observe interesting failure behavior, not so much that the system is hard to reason about.
- Step 2 — Containerize both services: Run them in isolated environments so you can control each one independently. This is what makes it possible to stop one service without stopping the other.
- Step 3 — Add monitoring before you add chaos: This is the rule that most people skip. You cannot learn anything from a chaos experiment if you cannot see what’s happening. Logs and basic metrics are the minimum.
- Step 4 — Start with the simplest possible failure: Shut down Service B and observe how Service A reacts. Does it retry, return a clear error, hang, or start affecting unrelated features? That behavior gives you your first real signals.
- Step 5 — Increase failure complexity gradually: Add artificial latency to Service B. Simulate packet loss. Make the database slow instead of unavailable. Test what happens when responses are malformed rather than absent. Each of these failure modes reveals something different about your system’s resilience.
- Step 6 — Run experiments with hypotheses: Before each experiment, write down what you expect to happen. “I believe Service A will retry three times and then return a 503.” Then test it. The gap between your prediction and reality is where the learning is.
Common Pitfalls
- Running chaos without monitoring — you’re just breaking things with no insight
- Injecting multiple failures simultaneously before you understand individual failure modes
- No clear hypothesis before each experiment, so you can’t interpret the results
3. Self-Healing Distributed Service
Traditional Approach
When a service crashes, you restart it manually. You get a notification — maybe from a user, maybe from a colleague or from a client — that something is down, and then you SSH into the server and bring it back up. This might take five minutes. It might take thirty.
Why This Is Hard
Manual intervention does not scale. Incidents happen at inconvenient times. The person on call might be asleep, or dealing with a different incident, or simply slow to respond. Every minute of downtime has a cost, and that cost accumulates.
The harder problem is detection. Knowing that a service needs to be restarted sounds simple. In practice, it requires distinguishing between a service that is truly down and one that is temporarily slow, or one that is failing for a specific class of request while handling others normally. Restart a service that’s just slow, and you might make things worse. Fail to restart a service that’s genuinely down, and you extend the outage.
Restart loops are another serious failure mode. If your recovery logic simply restarts a service whenever it fails, and the underlying cause of failure is still present, you end up with a service that crashes and restarts endlessly — consuming resources and generating noise without ever actually recovering.
How This Will Help You
You build the intuition that reliability is designed, not hoped for. You learn to think about failure modes before they occur and to build recovery strategies into the system from the beginning rather than treating recovery as a manual process.
Where to Start
- Step 1 — Add a health endpoint to every service: A
/healthroute should return meaningful status information — not just “I’m running” but “I’m running, my database connection is healthy, and my response times are within normal range.” The health check is only useful if it checks things that actually matter. - Step 2 — Build a monitoring loop: A separate process should periodically poll the health endpoint of every service and record the results. The polling interval matters — too frequent and you add unnecessary load; too infrequent and you’re slow to detect failures.
- Step 3 — Add recovery logic: When the health check fails, trigger a recovery action — a container restart, a process restart, a failover to a standby instance. The recovery action should be appropriate to the failure type. Not every failure requires a full restart.
- Step 4 — Add safeguards against restart loops: Retry the health check multiple times before triggering recovery. Add exponential backoff between recovery attempts. Set a maximum number of recovery attempts before escalating to a human. A system that restarts infinitely is not self-healing — it’s thrashing.
- Step 5 — Log every action: Record what failed, when, what health check data triggered the recovery decision, what action was taken, and whether it succeeded. This audit trail is essential for understanding complex failure sequences after the fact.
Common Pitfalls
- False positives that trigger unnecessary restarts and create instability
- Infinite restart loops caused by missing circuit breakers
- Health checks that only verify the service is running, not that it’s actually functional
4. Load Testing and Bottleneck Analyzer
Traditional Approach
If the application worked for you and a few teammates, you assume it scales. You’ve never tested it under load because there was no load to test under. The assumption remains untested until production.
Why This Is Hard
Systems do not scale linearly. A database that responds in 20 milliseconds under light load might take 800 milliseconds under thirty concurrent connections. An API that handles 50 requests per second gracefully might collapse at 200 — not because 200 is unreasonably large, but because a bottleneck somewhere in the stack becomes the constraint for the entire system.
The bottleneck is rarely where you expect it. Developers often assume CPU is the constraint. In practice, the bottleneck is frequently database connections, memory, network bandwidth, or a specific code path that does more work than it appears to. Finding it requires measurement, not intuition.
Misreading load test results is also common. Average latency is often misleading — what you care about is the 95th or 99th percentile, because that’s the experience your worst-served users are having. A system where most requests take 50 milliseconds but five percent take ten seconds has a serious problem that average latency will hide.
How This Will Help You
After this you will stop making assumptions about performance and start measuring it. You develop an understanding of where systems break and why, which makes you significantly better at designing systems that don’t break under expected load. You learn to read performance data with nuance rather than taking surface-level numbers at face value.
Where to Start
- Step 1 — Start with an existing service: Use the API from the observability project. You already have metrics instrumented, which makes interpreting load test results much easier.
- Step 2 — Write a load generation script: Start at a low level far below what you expect the system can handle. Increase gradually. You’re looking for the point where behavior changes — not the point where everything falls apart.
- Step 3 — Track the right metrics: Latency at the 50th, 95th, and 99th percentile. Error rate. Throughput in requests per second. These three together tell you much more than any single number alone.
- Step 4 — Run structured experiments: Pick a low level service, run for long enough to get stable measurements, record the results, increase the load, repeat. Make sure each step runs long enough for the system to reach a steady state — short bursts often look better than sustained load.
- Step 5 — Identify and investigate the bottleneck: When performance degrades, check CPU usage, memory, database connection counts, and network throughput simultaneously. The resource that’s maxed out while others have headroom is your bottleneck. Understand why before you try to fix it.
Common Pitfalls
- Simulating traffic that doesn’t resemble real usage patterns, leading to misleading results
- Reading only average latency and missing the tail
- Fixing the first bottleneck without checking whether a second one immediately becomes the constraint
Core Projects
These six projects are more focused in scope but no less important in practice. Each one targets a specific reliability skill that the flagship projects touch but don’t fully develop.
5. Rate Limiter System
Traditional Approach
No rate limiting at all. Any client can make as many requests as they want, as fast as they want. This works fine until it doesn’t — until a buggy client sends ten thousand requests in a second, or a single user monopolizes resources that other users need.
Why This Is Hard
Implementing a rate limiter correctly requires choosing between algorithms with different trade-offs. A fixed window counter is simple but allows burst traffic at window boundaries. A token bucket is smoother but more complex to implement. A leaky bucket enforces strict throughput but can feel unresponsive to legitimate bursts. Each choice has consequences for both system behavior and user experience.
Distributed rate limiting — where multiple instances of a service need to share rate limit state — adds another layer of complexity. A rate limiter that only works on a single instance provides weak guarantees in a load-balanced system.
How This Will Help You
You understand how systems protect themselves from being overwhelmed. You develop an appreciation for the difference between rate limiting strategies and when each is appropriate. This is directly applicable to API design, which is a skill you will use constantly.
Where to Start
- Step 1: First, begin with Token Bucket: Implement a per-client token bucket with a fixed refill rate. Consume one token per request and reject requests when the bucket is empty. Initially, keep it in-memory (single instance) for simplicity.
- Step 2: Next, validate core behavior: Test the system under both steady traffic and burst traffic. Ensure the refill timing is correct and edge cases are handled properly.
- Step 3: Then, implement Leaky Bucket: Enforce a constant request processing rate. Queue or drop excess requests, and compare its behavior with the token bucket under burst conditions.
- Step 4: After that, compare trade-offs: Token bucket allows bursts and feels flexible, while leaky bucket enforces a strict and smooth output rate. Observe how each approach impacts user experience.
- Step 5: Now, add distributed support: Use Redis for shared state so rate limits remain consistent across multiple instances. Carefully handle race conditions and data consistency.
- Step 6: Subsequently, test in a load-balanced setup: Simulate multiple service instances and verify that global rate limiting behaves correctly across the system.
- Step 7: Finally, explore advanced approaches (optional): Implement a sliding window algorithm and combine it with ARQ (Automatic Repeat reQuest) concepts to improve fairness and retry handling.
Common Pitfalls
- Choosing the Wrong Algorithm: Using a simple fixed window in high-traffic systems can cause burst spikes, while overly strict algorithms can degrade user experience. The choice must match your traffic pattern.
- Per-Instance Limiting Only: An in-memory limiter works on a single node but fails in distributed setups. Without shared state, clients can bypass limits by hitting different instances.
- Poor Handling of Bursts and Retries: Rejecting all excess traffic without considering retries or short bursts can make the system feel unreliable, especially for legitimate users.
- Race Conditions in Distributed Systems: When using shared stores like Redis, improper atomic operations can lead to inconsistent rate enforcement under concurrency.
6. CI/CD Pipeline with Failure Gates
Traditional Approach
Deploy manually. Run tests locally if at all. Assume that if it works on your machine, it will work in production.
Why This Is Hard
Manual deployment is slow, inconsistent, and error-prone. Different developers deploy differently. Tests that pass locally fail in production because the environments are different. A bad deployment that should have been caught by an automated check instead makes it to production because no automated check existed.
Building a pipeline with real failure gates — not just a CI system that runs tests but one that actively prevents deployment when quality standards aren’t met — requires deciding what “quality” means and encoding that definition into automation. That’s a harder problem than it sounds.
How This Will Help You
You develop a concrete understanding of the deployment process and where failures are caught at each stage. You learn to think about quality as something that can be measured and gated, not just asserted. This is one of the highest-leverage skills in professional software development.
Where to Start
- Step 1: First, define your quality gates: Decide what “quality” means for your system. At minimum, include unit tests, integration tests, performance benchmarks, and code quality checks.
- Step 2: Next, enforce unit testing: Ensure all unit tests pass before anything moves forward in the pipeline.
- Step 3: Then, validate integration tests: Confirm that different components of your system work together correctly.
- Step 4: After that, add performance benchmarks: Define acceptable limits and ensure your application stays within them under expected load.
- Step 5: Now, apply code quality standards: Set thresholds for linting, complexity, and maintainability to keep the codebase healthy.
- Step 6: Subsequently, automate failure gates: Configure the pipeline to automatically block deployment if any of the above checks fail.
- Step 7: Finally, provide clear feedback: Ensure the pipeline outputs exactly what failed and why, so issues can be fixed quickly.
Common Pitfalls
- Weak or Meaningless Gates: If your checks are too lenient or don’t reflect real-world conditions, bad code still gets through. Gates should enforce actual quality, not just pass everything.
- Overly Strict Pipelines: On the flip side, making gates too rigid slows down development and frustrates teams. If everything fails all the time, people start looking for ways to bypass the system.
- Ignoring Environment Parity: Tests passing in CI don’t mean much if the CI environment differs from production. Mismatched configs, dependencies, or data can still cause failures post-deploy.
- Poor Feedback and Visibility: If developers can’t quickly understand why a pipeline failed, fixing issues becomes slow and painful. Clear, actionable feedback is critical for adoption.
7. Log Aggregation System
Traditional Approach
Each service logs to its own file. When something goes wrong, you SSH into each server individually, search through each log file separately, and try to mentally correlate events across multiple streams. This is slow, error-prone, and completely impractical beyond two or three services.
Why This Is Hard
Centralizing logs from multiple services requires solving several problems simultaneously: consistent log format across services written by different people in different languages, reliable log shipping that doesn’t drop messages under high load, efficient storage and indexing so that logs remain searchable at volume, and access control so that sensitive information is visible only to those who need it.
How This Will Help You
You start to see the entire journey of a log entry, from the moment it’s written in code to the point it’s retrieved during an incident. It makes clear why consistent log formats are enforced so strictly in real systems, and it noticeably improves how quickly you can debug across services.
Where to Start
- Step 1: First, select your services: Pick three services from your previous projects so you can simulate a realistic multi-service environment.
- Step 2: Next, standardize the log format: Convert all logs to a consistent JSON structure with uniform field names (e.g., timestamp, service name, log level, message).
- Step 3: Then, build a log shipper: Create a component that reads logs from each service and forwards them reliably to a central destination.
- Step 4: After that, set up a central log store: Store incoming logs in a system where they can be indexed and queried efficiently.
- Step 5: Now, add a query interface: Build a simple way to search and filter logs across all services in one place.
- Step 6: Subsequently, simulate a multi-service failure: Introduce a failure that spans all three services to generate correlated log events.
- Step 7: Finally, practice tracing issues: Use your aggregated logs to follow the flow of the failure across services and identify the root cause.
Common Pitfalls
- Inconsistent Log Formats: If each service logs differently, aggregation becomes messy and querying across services turns into guesswork instead of insight.
- Dropped or Delayed Logs: Poorly designed log shippers can lose logs under high load or introduce delays, which breaks the reliability of your debugging data.
- Logging Too Much or Too Little: Excessive logs create noise and increase storage cost, while insufficient logs leave gaps during incident analysis. Striking the right balance is key.
- Ignoring Sensitive Data: Logs often contain secrets, tokens, or user data. Without proper filtering and access control, your log system becomes a security risk.
8. Service Dependency Visualizer
Traditional Approach
You understand your service and have a general idea of its dependencies, but there’s no clear, up-to-date map of how everything connects, and no one has documented it reliably.
Why This Is Hard
Service dependencies change faster than documentation. A diagram drawn six months ago is likely already inaccurate. The only reliable source of truth for what a service actually depends on is the service itself — its outgoing connections, its configuration, its behavior at runtime.
Understanding failure impact requires understanding the full dependency graph. If Service A fails, what else fails? Not just the services that call A directly, but the services that call the services that call A. This is a graph traversal problem, and it’s much harder to reason about without a visual map.
How This Will Help You
You develop a graph-based mental model for distributed systems, which directly applies your knowledge of graph algorithms to a real engineering problem. You get intuition for blast radius — the scope of impact when any given service fails — which is essential for making good architectural decisions.
Where to Start
Step 1: Extract Runtime Dependency Data
Modify each service to expose its outgoing dependencies. This can be done via:
- A
/dependenciesHTTP endpoint - Startup logs or structured telemetry
- Service mesh data (if available)
Each service should report what it calls (APIs, databases, queues, external services).
Step 2: Normalize and Collect Data
Build a collector service that periodically queries all services and gathers their dependency data.
- Store results in a consistent format (e.g., JSON)
- Normalize naming (avoid duplicates like
auth-servicevsauth_svc) - Version or timestamp the data to track changes over time
Step 3: Construct the Dependency Graph
Represent the system as a directed graph:
- Nodes = services
- Edges = “depends on” relationships
Use a graph structure (adjacency list or matrix). Libraries like NetworkX (Python) or graph packages in Go can help here.
Step 4: Visualize the Graph
Render the graph to make it human-readable:
- Use tools like Graphviz, D3.js, or Cytoscape
- Highlight critical nodes (high-degree or high-centrality services)
- Allow filtering (by team, domain, environment)
Step 5: Implement Graph Traversal for Impact Analysis
Simulate failures using traversal algorithms:
- Start from a node (failed service)
- Traverse downstream dependencies (BFS or DFS)
- Identify all affected services (direct + indirect)
This gives you the blast radius.
Step 6: Add Metrics and Risk Scoring
Enhance the model with:
- Request volume (traffic weight on edges)
- Criticality tags (e.g., payment, auth)
- Redundancy/fallback paths
Use this to rank services by failure impact.
Step 7: Automate and Keep It Fresh
- Schedule periodic graph rebuilds
- Trigger updates on deployments
- Alert on major topology changes
The goal is to make the graph a living representation, not a static diagram.
Common Pitfalls
- Stale Data: If the graph isn’t updated continuously, it quickly becomes unreliable and misleading.
- Incomplete Dependencies: Only tracking direct calls (like HTTP) misses async jobs, queues, and third-party services.
- Too Much Noise: Including every minor interaction clutters the graph. Focus only on meaningful dependencies.
- Ignoring Failure Behavior: Not all dependencies fail the same way. Retries, caching, and fallbacks can change the real blast radius.
9. Smart Alerting System
Traditional Approach
Alert on everything. If something looks unusual, fire an alert. The result is a constant stream of notifications, most of which don’t require action, until the team has learned to ignore them completely.
Why This Is Hard
Good alerting is a precision problem. An alert should fire when a human needs to take action, and only then. This requires defining what “needs action” means in quantitative terms, which requires understanding the baseline behavior of your system well enough to distinguish anomalies from normal variation.
Alert fatigue is a genuine safety risk. When teams are desensitized to alerts because too many of them are false positives, the alerts that actually matter get missed. Poorly designed alerting is not just annoying — it creates the illusion of safety without the substance.
How This Will Help You
You develop the discipline of thinking carefully about what signals actually indicate problems, rather than alerting defensively on every metric that could conceivably change. This is a valuable instinct in any engineering context, not just SRE.
Where to Start
Step 1: Define Actionable Signals: Start by identifying what actually requires human intervention. Focus on high-signal metrics like error rate, latency, and availability instead of everything that moves.
Step 2: Use Time-Based Conditions: Avoid instant thresholds. Evaluate metrics over time windows (e.g., error rate > 2% for 5 minutes) to filter out normal fluctuations.
Step 3: Implement Deduplication: Ensure repeated triggers from the same issue generate a single alert. Group related signals to avoid alert floods.
Step 4: Add Severity and Escalation: Classify alerts (warning, critical) and define escalation rules if alerts go unacknowledged for a certain period.
Common Pitfalls
- Alerting on Everything: Too many low-value alerts quickly lead to alert fatigue and ignored notifications.
- Noisy Thresholds: Static or overly sensitive thresholds trigger alerts during normal system behavior.
- Lack of Ownership: Alerts without clear owners or response expectations often go unresolved.
- Ignoring Alert Quality: If alerts aren’t reviewed and tuned regularly, they degrade over time and lose usefulness.
10. Backup and Disaster Recovery Simulator
Traditional Approach
No backups, or backups that have never been tested. An untested backup is not a backup — it’s the hope of a backup. The only way to know whether your recovery process works is to run it.
Why This Is Hard
Disaster recovery is uncomfortable to practice because it requires simulating loss. Psychologically, it’s easier to assume the backup works than to verify it. Technically, a full recovery drill requires standing up infrastructure, restoring data, verifying integrity, and measuring how long the process took — a significant investment that doesn’t produce anything new.
Recovery time also degrades over time. A process that took fifteen minutes to run when it was designed might take two hours after a year of database growth and infrastructure changes. Without regular testing, you won’t know until the disaster is real.
How This Will Help You
You internalize that reliability requires practice, not just planning. You learn to measure recovery time objectively — Recovery Time Objective (RTO) and Recovery Point Objective (RPO) are the two key metrics — and to design backup strategies around those targets rather than hoping for the best.
Where to Start
Step 1: Define RTO and RPO Targets:
Decide how fast you need to recover (RTO) and how much data loss is acceptable (RPO). These targets will shape your entire backup strategy.
Step 2: Implement Automated Backups:
Set up reliable, scheduled backups for a real service (database, configs, critical state). Ensure backups are stored securely and can be accessed independently of the primary system.
Step 3: Simulate Failures:
Create controlled failure scenarios:
- Drop or wipe a database
- Corrupt partial data
- Remove critical configuration
This forces you to rely on the backup, not assumptions.
Step 4: Execute and Measure Recovery:
Follow your recovery process exactly as documented.
Measure:
- Total recovery time (actual vs RTO)
- Data restored (actual vs RPO)
Common Pitfalls
- Untested Backups: Backups that have never been restored are unreliable by definition.
- Ignoring Growth Over Time: Recovery that was fast initially can become slow as data and complexity increase.
- Partial Recovery Blind Spots: Restoring data without verifying integrity or application functionality leads to hidden failures.
- No Regular Drills: Without scheduled testing, recovery procedures drift out of date and fail when needed most.
Where DSA Actually Comes Back
At this point, it’s worth making the connection explicit. None of the projects above require you to abandon your foundational knowledge. They require you to apply it in environments that are less controlled than you’re used to.
The graph algorithms you studied are how you reason about service dependencies and failure propagation. The queue data structure is how you think about request buffering and backpressure. Hash maps are the mental model behind every caching layer. Exponential backoff — the algorithm that governs how systems retry failed requests — is a computer science concept with direct production applications. Time complexity analysis is how you predict which part of your system will buckle first under load.
You’re not starting over. You’re extending what you know into a messier, more interesting domain.
Conclusion
Most projects teach you to build something that works. SRE teaches you to build something that keeps working — through failure, through scale, through the incidents that nobody planned for and everybody has to respond to.
If you start developing this thinking in second year, you’re not just ahead on tools. You’re ahead in judgment. You’ve asked the questions that most of your peers haven’t thought to ask yet. You’ve built systems that surprised you, broke on you, and recovered — and you understand why.
That understanding compounds. It shapes how you read other people’s code, how you design your own systems, how you approach ambiguous problems in interviews and on the job. It’s the difference between an engineer who builds features and an engineer who builds systems.
Start with the observability project. Get visibility first. Everything else follows from knowing what your system is actually doing.
Reference
- Google SRE Book — “Site Reliability Engineering: How Google Runs Production Systems”
https://sre.google/sre-book/table-of-contents/ - Google SRE Workbook — Practical implementation of SRE concepts
https://sre.google/workbook/table-of-contents/ - “Designing Data-Intensive Applications” — Martin Kleppmann
- Prometheus Documentation (Metrics & Monitoring)
https://prometheus.io/docs/introduction/overview/ - Grafana Documentation (Visualization & Dashboards)
https://grafana.com/docs/ - Chaos Engineering Principles
https://principlesofchaos.org/ - AWS Well-Architected Framework — Reliability Pillar
https://docs.aws.amazon.com/wellarchitected/latest/reliability-pillar/


Leave a Reply